How Database Connection Pools Actually Work Under the Hood (A Deep Dive)
On this page
Imagine you are running a high-traffic production application. Suddenly, you notice that your API response time has jumped from 50 milliseconds to 3 or 4 seconds. System alerts start going off everywhere. Your first thought might be that the database has become slow.
You quickly check the database dashboard. However, you see that the CPU usage is completely normal, memory is fine, and there are no unusual spikes in disk I/O. Next, you look at the application server, and there are no massive CPU or memory spikes there either.
So where exactly are the requests getting stuck?
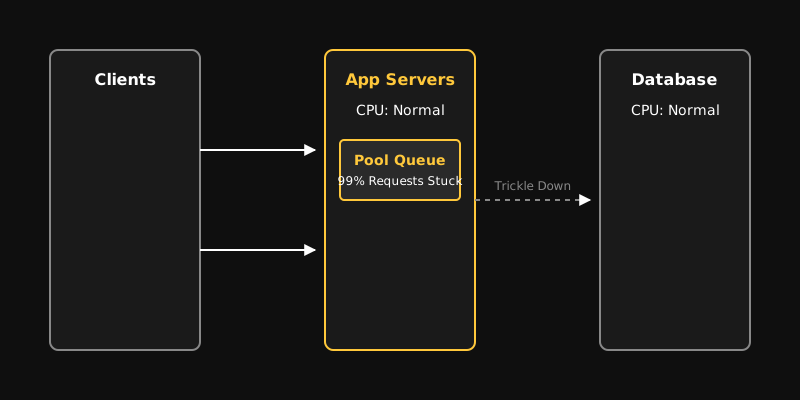
This is where our deep dive begins. Often, the real bottleneck in an application is not the database query execution time, but rather the time requests spend waiting just to get a database connection. Today, we will walk through exactly how a database connection pool works, why it is so difficult to scale, and how you can find this hidden bottleneck in your own system.
Mental Model: What Exactly is a Database Connection?
If you think of a database connection as just a simple TCP socket, you will miss the bigger picture. When an application creates a new connection with a database, a lot of expensive operations happen behind the scenes.
First, a standard TCP 3-way handshake takes place. After that, a TLS handshake occurs for security, which involves certificate validation and symmetric key negotiation. Next, database-level authentication and authorization happen. Once the authentication is successful, the database allocates a dedicated memory context in its own memory just for this session.
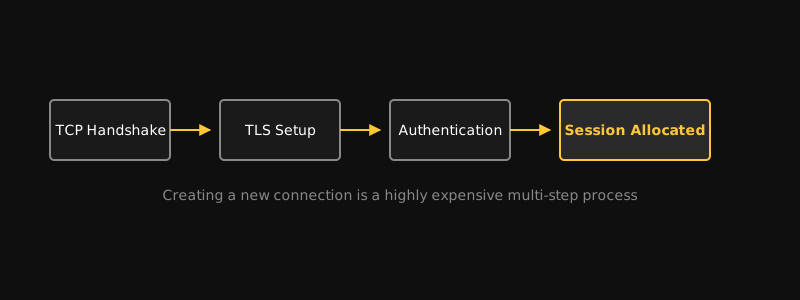
This entire process is incredibly time-consuming and resource-intensive. If your application has to go through this complete cycle for every single request, your application latency will increase drastically.
The Problem with a Pool-less Architecture
First, imagine a naive architecture where there is no connection pool at all. Every incoming request creates a completely new connection just to talk to the database.
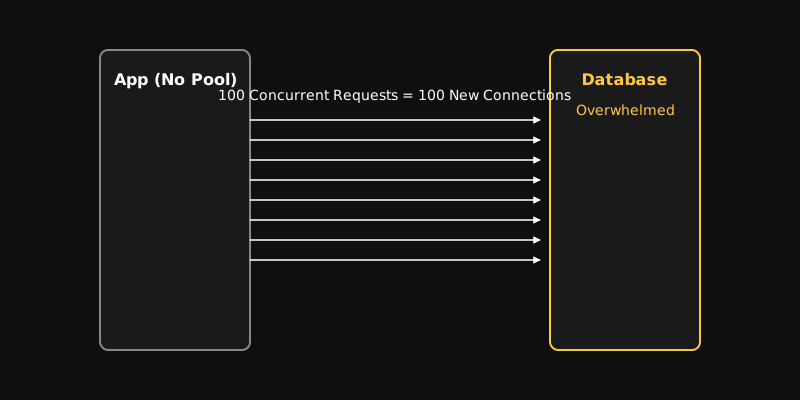
When traffic is low, this setup works fine. But as traffic grows, the number of connection creations increases exponentially. If hundreds or thousands of concurrent requests come in, the database faces much more pressure from creating new connections than from actually executing queries. Eventually, the database stops accepting new connections, and the application crashes.
The Core Idea Behind a Connection Pool
The connection pool was created specifically to solve this exact problem. A connection pool essentially creates and holds a number of database connections ahead of time. It acts as a shared, reusable resource manager.
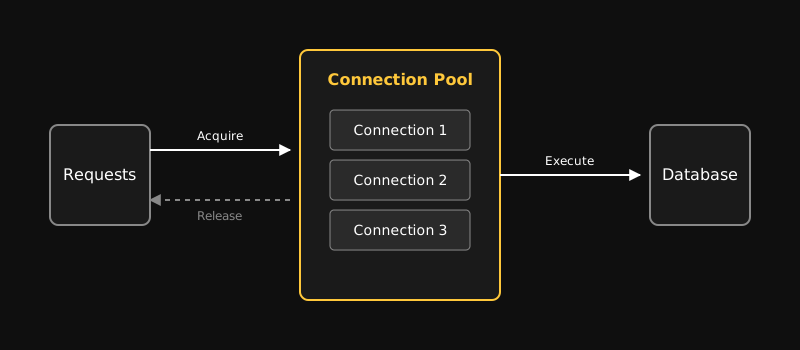
When a request needs database access, it does not create a new connection. Instead, it borrows an existing connection from the pool. Once the database work is done, the request does not destroy the connection. It returns the connection back to the pool. As a result, a single connection can sequentially process thousands of requests throughout the day.
We can use a great analogy here. Imagine you visit a library. The library has 10 chairs for reading. You sit in one of the chairs to read. When you finish reading, you do not break the chair. Instead, you leave the chair so someone else can sit down. A connection pool works exactly like this.
Pool Internal Architecture
The internal state of a real-world connection pool can be quite complex. The pool generally manages four types of states: min connections, max connections, idle connections, and active connections.
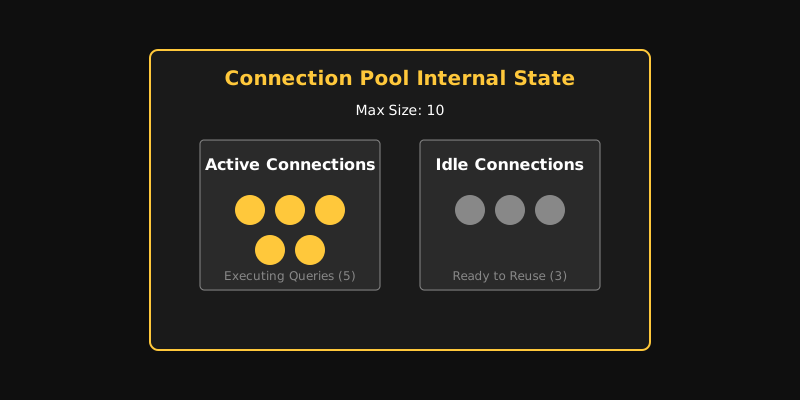
The pool does not just store connections. It strictly manages the lifecycle of connection allocation and release. Among these, the most important parameter is max connections. This parameter determines the absolute maximum number of database operations your application can run at the exact same time.
Connection Acquire and the Hidden Queue
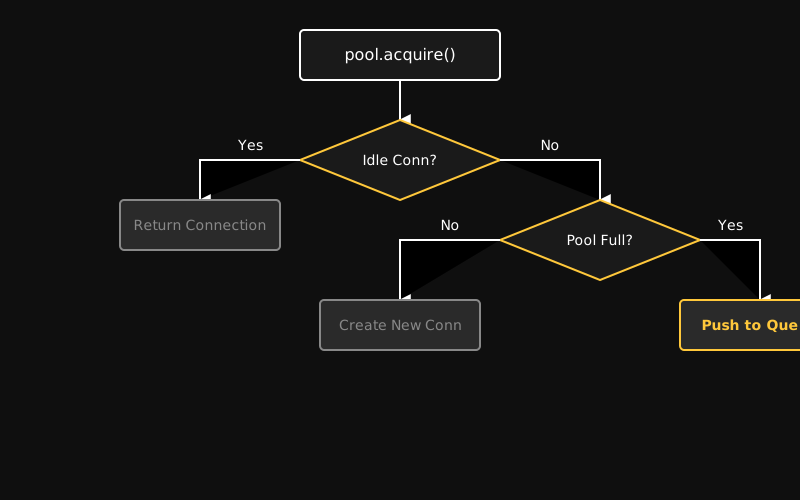
When a request wants to talk to the database, it first asks the pool for a connection using pool.acquire(). The pool checks if it has any idle connections available. If it does, it hands the connection to the request immediately.
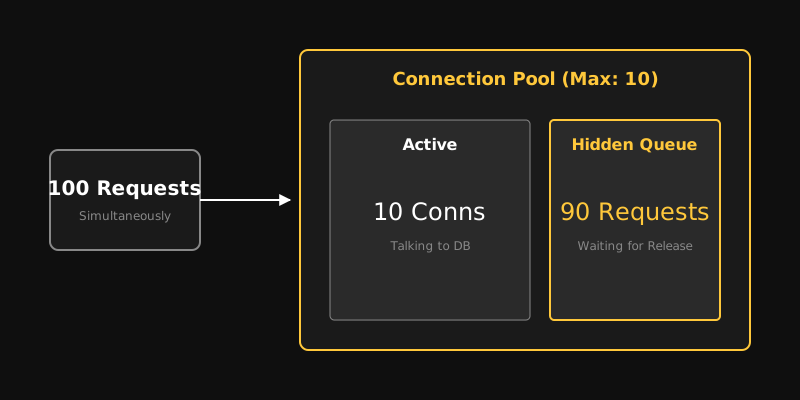
If there are no idle connections, the pool checks if it has the capacity to create a new one. This means it checks if the max connections limit has been reached. If there is capacity, a new connection is created. But if the capacity is completely exhausted, the request is pushed into a hidden waiting queue.
This queue is the primary cause of high latency in heavy-traffic systems. When 100 requests arrive at the same time and the pool size is only 10, the remaining 90 requests have to stand in line.
Tip
If requests get stuck in the queue for too long, your API response will become slow. You should always monitor the pool waiting queue size and the acquisition latency in your observability tools.
Connection Release vs Close
After a query finishes, the connection is usually not closed. Instead, it is released. This means the connection is not completely disconnected from the database, but rather returned to the idle state inside the pool.
This is a critical concept for developers to understand. If an exception happens in your code and the connection is not properly released, it gets permanently lost from the pool. We call this a connection leak.
const connection = await pool.acquire();
try {  await connection.query('SELECT * FROM users');} finally {  // Even if an error occurs, the connection must be returned to the pool  connection.release();}
Wait Time vs Query Time
The total database latency for a request is basically the sum of a few different parts. Let us say one of your requests took 830 milliseconds to fetch data from the database. You might think your query is just very slow.
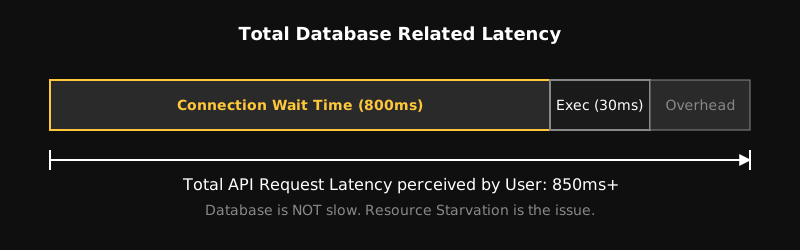
But if you break it down deeply, you might see that the request waited in the pool queue for 800 milliseconds just to get a connection. The actual query execution only took 30 milliseconds. Even though the whole experience feels slow to the user, the database itself is not slow at all. The real problem here is resource starvation.
Warning
If you only look at query execution latency in production, you have a high chance of missing the actual bottleneck. Always measure connection wait time separately.
Why a Larger Pool Does Not Mean Better Performance
Many people assume that increasing the pool size from 10 to 100 or 500 will automatically make the application much faster. The reality is entirely different.
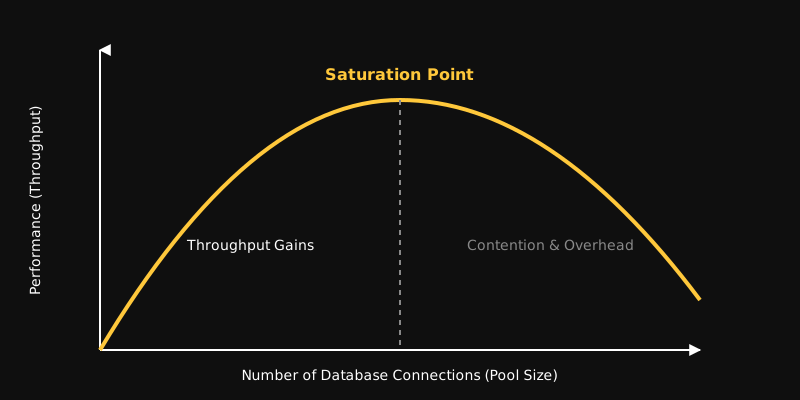
More connections mean more concurrent tasks hitting the database. For every concurrent task, the database has to share CPU time, memory, locks, and disk I/O. When the number of concurrent tasks pushes past the processing capacity of the database, the overall performance drops massively due to internal contention and context switching. This is known as the saturation point.
The Multi-Instance Production Trap
In a local development environment, you might only run a single application instance. If your pool size is 20 there, everything will feel absolutely perfect. But when you scale your application horizontally in production, the math completely changes.

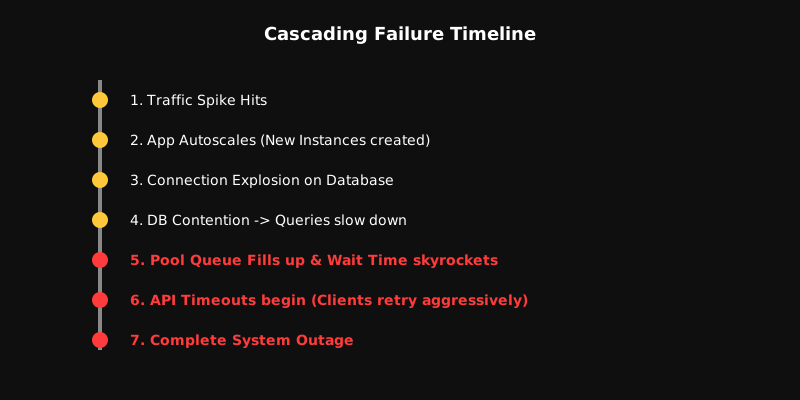
Let us say you are running 20 instances in production. If every instance has a pool size of 20, the theoretical maximum number of connections hitting your database becomes 400 (20 x 20). With autoscaling enabled in systems like Kubernetes, your instance count grows as traffic increases. This causes your database connections to multiply exponentially. While it is very easy to scale an application, your database simply cannot scale the exact same way.
The Cost of Database-Side Connections
Now that we understand the application-side pool, let us look at it from the database perspective. PostgreSQL forks a separate OS process for every single connection. It also maintains session-related memory context and temporary tables for each one.
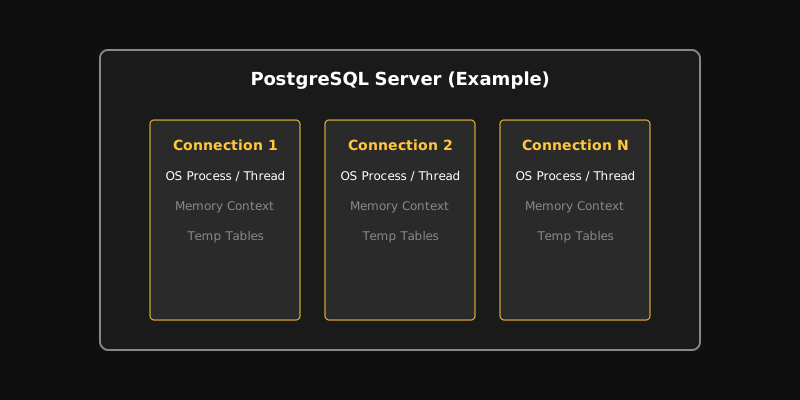
This means that as the connection count goes up, it is not just network traffic that increases. The database consumes its own memory and processing power as well. If the connection count gets too high, the database ends up spending more time managing connections than actually processing queries.
Pool Exhaustion and Cascading Failures
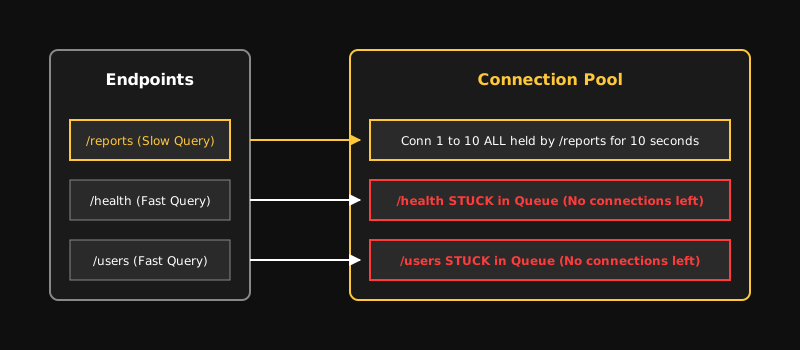
Pool exhaustion happens when every connection in the pool is busy and there are no available connections for incoming requests. At this point, new requests start piling up in the queue.
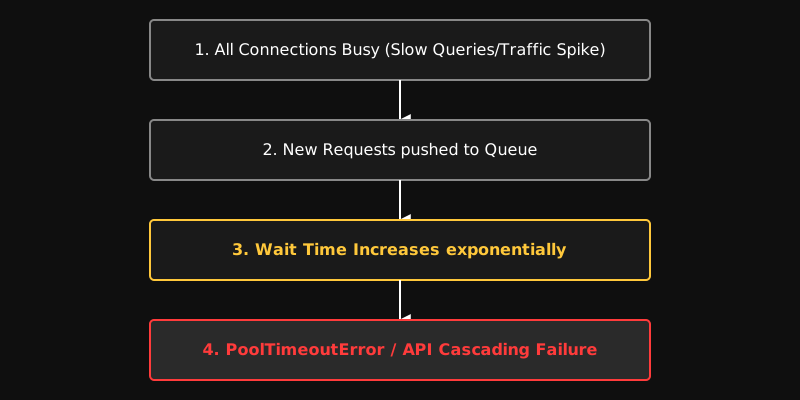
As the queue grows larger, the wait time to get a connection keeps increasing. Eventually, the pool times out and the requests fail. If a slow query keeps running on the database for some reason, it holds onto its connection. As a result, other completely unrelated fast queries get stuck simply because they cannot get a connection.
Error
Pool Leaks and Cascading Failures: If you do not release a connection in a finally block after acquiring it, your pool slowly dies. Everything might look fine at first, but after a while, your entire system can come to a complete halt.
Transactions and Connection Affinity
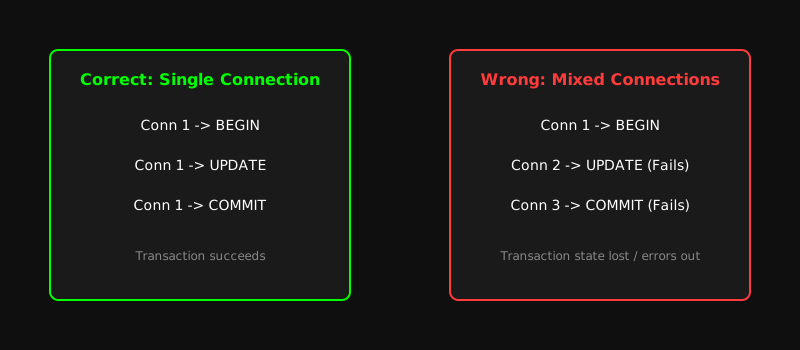
Compared to regular queries, transactions put a much heavier load on database connections. Once a transaction starts with BEGIN, it must hold onto the exact same connection for the entire duration until it hits COMMIT or ROLLBACK.
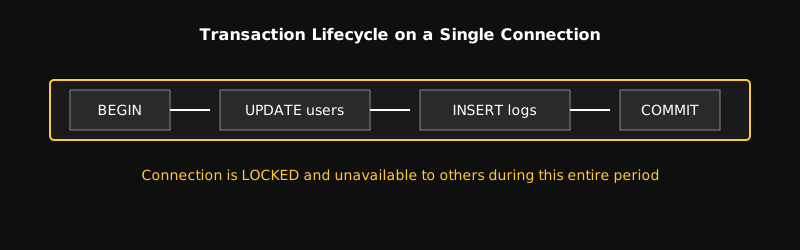
As long as the transaction stays open, that specific connection remains unavailable to any other request. This concept is called connection affinity. If you send a BEGIN statement on one connection and a COMMIT statement on a totally different connection, the transaction semantics will completely break down.
Timeouts and Connection Lifecycle
Managing timeouts in production systems is a highly critical task. Not all timeouts are the same, and they need to follow a clear hierarchy.
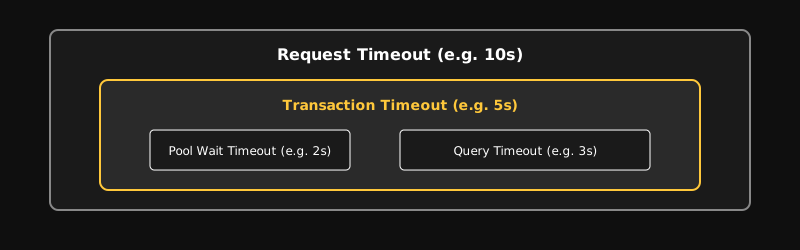
- Request Timeout: The maximum time a client or gateway will wait for the entire request.
- Transaction Timeout: The maximum time a database transaction is allowed to stay open.
- Pool Wait Timeout: The maximum time a request will wait to get a connection from the pool.
- Query Timeout: The maximum time a single query is allowed to run inside the database.
Connections do not live forever. They can drop because of network failures or database restarts. The pool needs to routinely check idle connections using health checks like SELECT 1. It must discard stale connections and create fresh ones.

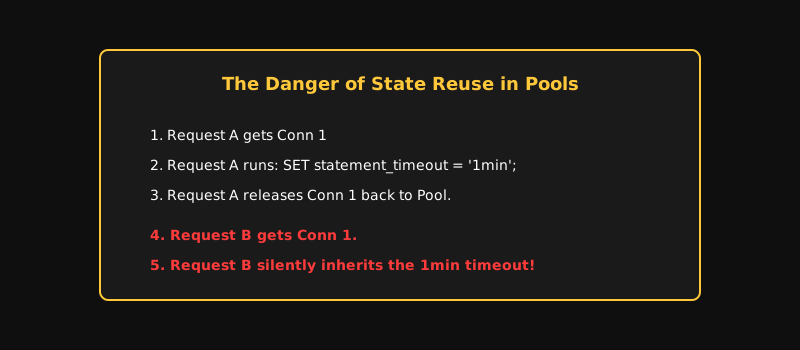
When a connection is reused across different requests, the state from the previous session can accidentally affect the next request. Things like SET statement_timeout or temporary tables can cause silent bugs in production if they bleed over.
Info
Before reusing a connection, make sure all session variables and states are completely reset using commands like DISCARD ALL or RESET ALL.
PgBouncer and Serverless Architectures
In large-scale production environments, an application-side pool alone is not enough. For PostgreSQL, an external connection pooler like PgBouncer is heavily used. It acts as a central proxy layer in front of the database. It multiplexes thousands of application connections down into a very small number of actual database connections.

In serverless architectures like AWS Lambda, this problem gets much worse. During a traffic spike, hundreds of short-lived execution instances spin up. If every single one tries to create its own connection, the database connections will instantly explode and crash the system.

Connection Storms and Retries
Imagine your database restarts and goes down for 10 seconds. Your application instances will lose their connections. When the database comes back online, if all the instances suddenly try to reconnect at the exact same time, it hits the database with a massive shock. We call this a connection storm.
You can help the database recover safely by spreading out these retries over time using exponential backoff and jitter.
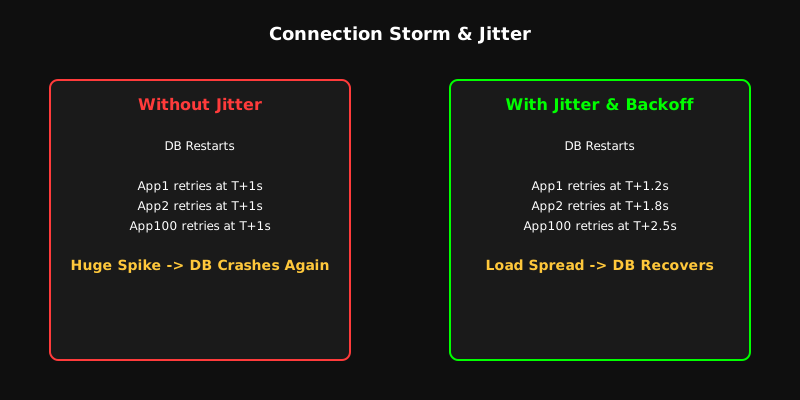
On top of that, if the database is slow and your application keeps sending aggressive retries, the workload on the database increases even more. This traps your system in a deadly feedback loop.

Production Observability and Debugging
To find problems in a production system, looking at query latency alone is never enough. You have to measure how busy the pool is, how many requests are waiting for a connection, and what the acquisition latency looks like.
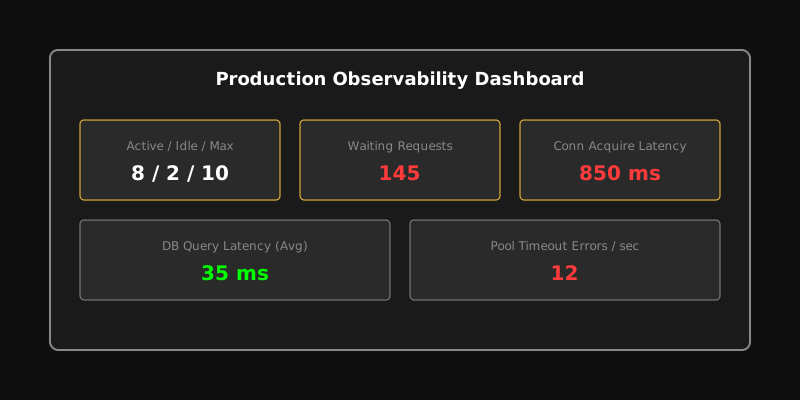
When debugging, do not rely on guesses. Investigate the issue by following this triage tree:

Understanding Capacity with Queueing Theory
Figuring out the size of your connection pool is not a guessing game. You can get a mathematical estimate using Little's Law:
If your system receives 500 requests per second and each connection is busy for an average of 0.1 seconds, your required concurrency will be 50 connections.
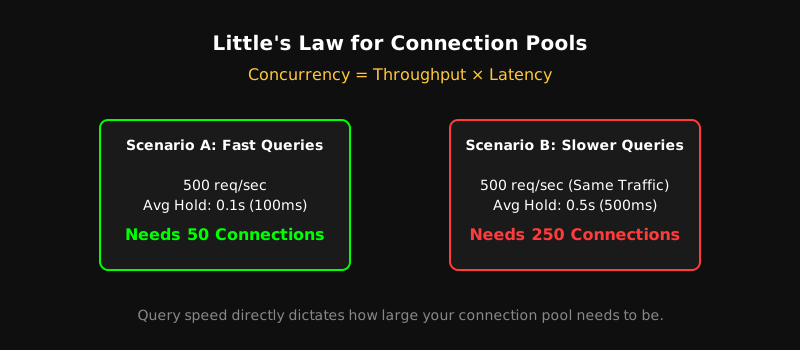
If your queries or transactions start taking longer, you will need exponentially more connections to handle that exact same amount of traffic.
Balanced Production Architecture
When we bring all these concepts together, we get a balanced, production-ready architecture. This setup includes multiple application instances, each with its own bounded connection pool. A central pooler like PgBouncer sits in the middle, and the database connection capacity remains strictly controlled.

To prevent the entire system from crashing during an incident, you need active circuit breaker policies, timeouts, and retries with jitter at every single layer.
Final Developer Checklist
To size your pool correctly and keep your system stable, you should follow a solid decision framework and checklist:

- Calculate the total number of application instances before setting your
pool.maxvalue. - Monitor your connection acquisition latency and pool waiting queue regularly on your dashboards.
- Make absolutely sure you
release()your connection in afinallyblock as soon as the database work is done. - Keep your transactions as short as possible.
- Never place external API calls inside a database transaction.
- Configure your pool timeout, query timeout, and request timeout separately.
- If you are running in a serverless environment, make sure to use PgBouncer or an RDS Proxy.
- Implement a reconnect strategy with exponential backoff and jitter to prepare for database restarts and network failures.
The Ultimate Mental Model
It is a mistake to think of a connection pool as just a tool for reusing connections. It is essentially a concurrency control layer that sits between your application and your database. It controls exactly how many operations can apply pressure on the database at the exact same time.

A database connection is a highly limited resource. Without proper architecture and management, no application can successfully scale in a production environment.